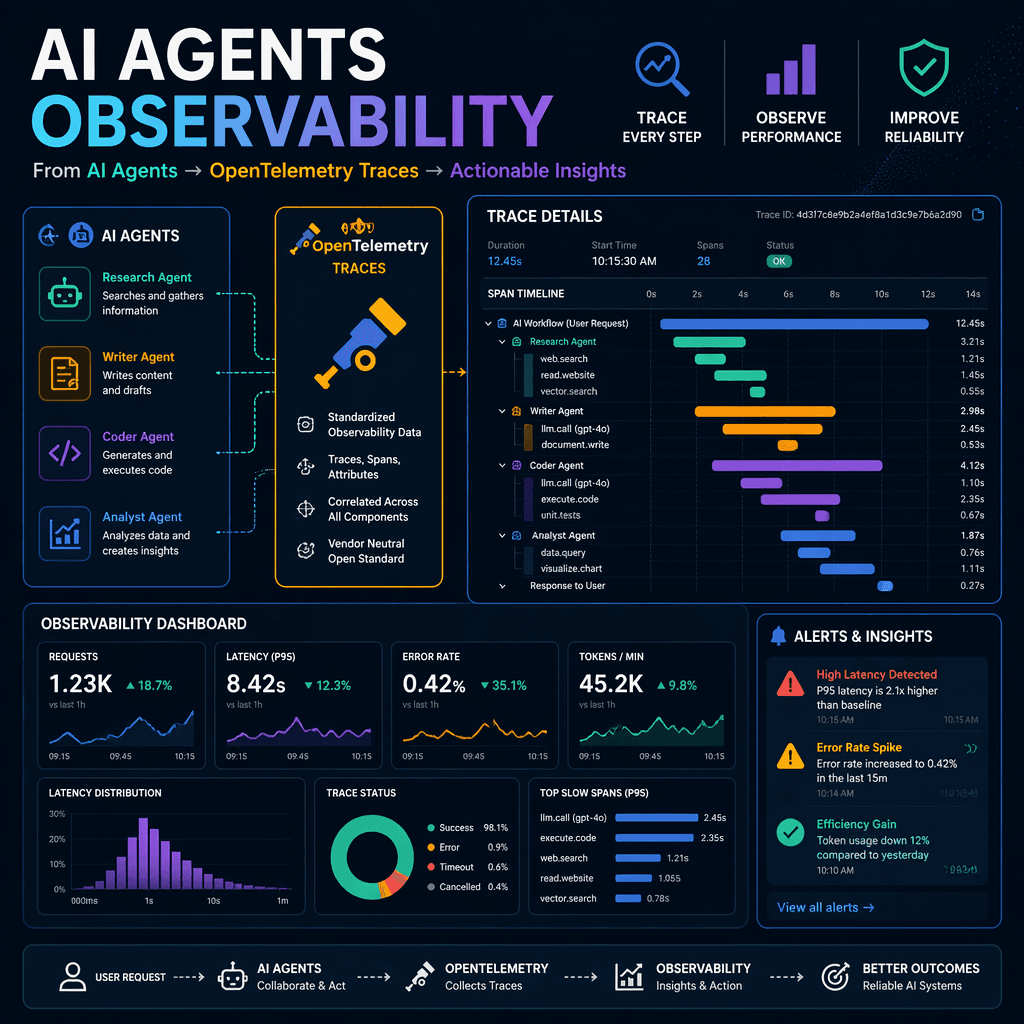
As AI agent systems transition from research prototypes to production environments, the need for robust observability becomes paramount. Unlike traditional applications, AI workflows involve intricate interactions between agents, large language model (LLM) calls, and external systems. Debugging and optimizing these workflows without proper observability is akin to navigating a maze blindfolded.
The Observability Challenge in AI Workflows
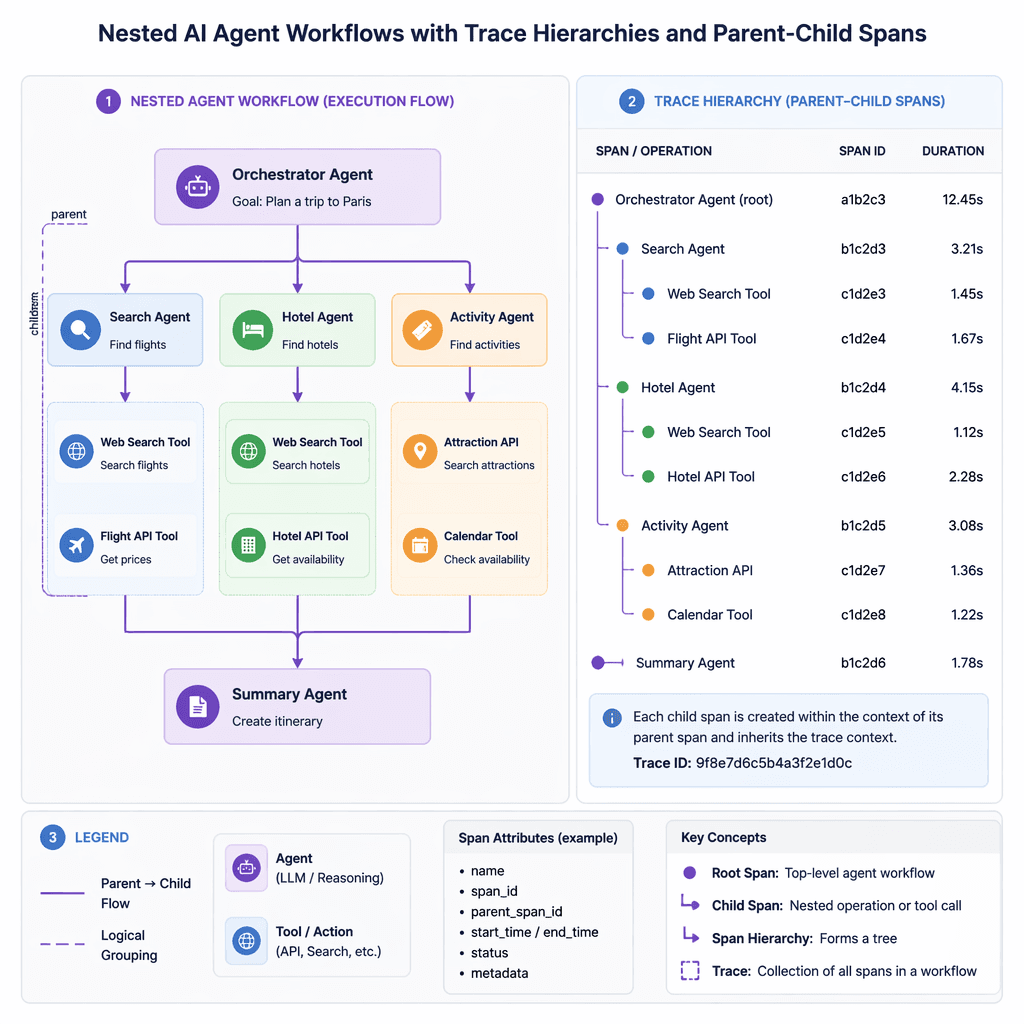
AI workflows differ significantly from traditional request-response architectures. They often involve long-running processes, non-deterministic behavior, complex state management, and nested execution patterns. For example, an agent might spawn sub-tasks or recursively invoke other agents, creating a web of dependencies that is difficult to untangle without structured telemetry data. Additionally, each LLM call incurs latency and financial costs, making performance and cost tracking essential.
Key Takeaways
- AI workflows are inherently complex due to their non-deterministic and nested nature.
- Traditional observability tools struggle to capture the nuances of multi-agent systems.
- Without proper observability, debugging failures in AI workflows becomes highly inefficient.
Observability is not just a debugging tool; it is a cornerstone for scaling AI systems reliably.
What is OpenTelemetry?
OpenTelemetry (OTel) is an open standard for collecting, generating, and exporting telemetry data such as traces, metrics, and logs. It has emerged as the industry standard for observability, supported by platforms like Jaeger, Prometheus, Datadog, and specialized AI observability tools like Langfuse and Phoenix. OpenTelemetry's core concepts include traces, spans, and semantic conventions, which provide structured insights into system behavior.
| Signal | Why it matters |
|---|---|
| Traces | Capture the journey of a request through the system. |
| Spans | Represent individual operations within a trace. |
| Semantic Conventions | Standardize attribute names for better interoperability. |
KaibanJS: A Framework for Multi-Agent Workflows
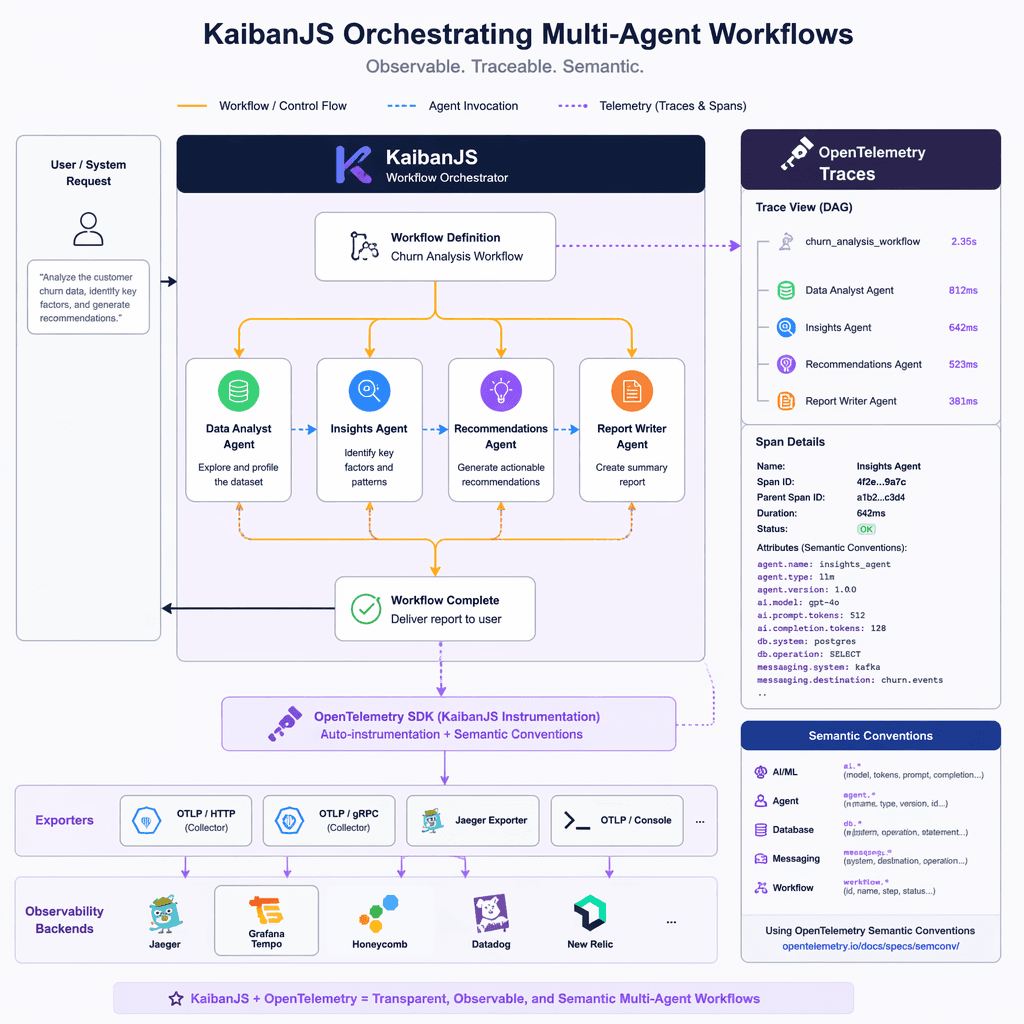
KaibanJS is a framework designed for orchestrating multi-agent workflows in production environments. It provides features like explicit task dependencies, agent specialization, and event-driven architecture, making it an ideal candidate for integrating OpenTelemetry. Its structured approach to workflow orchestration aligns naturally with OpenTelemetry's trace hierarchies.
- Explicit task dependencies ensure proper execution order.
- Agent specialization promotes clear separation of concerns.
- Event-driven architecture enables extensibility and observability.
Introducing @kaibanjs/opentelemetry
The `@kaibanjs/opentelemetry` package bridges KaibanJS workflows with OpenTelemetry. It automatically instruments workflows by subscribing to internal events, mapping them to spans, and enriching them with context such as token usage and model information. This non-invasive approach allows developers to add observability without modifying existing workflow code.
Builder note
Instrumenting workflows with OpenTelemetry provides visibility into agent interactions, LLM performance, and task execution patterns, enabling faster debugging and optimization.
Implementation Guidance
To instrument a workflow, developers can use the `@kaibanjs/opentelemetry` package to enable tracing. For example, in a content processing system, agents like 'ContentExtractor' and 'ContentAnalyzer' can be defined with specific roles and goals. The package listens to workflow events and exports structured traces to configured observability platforms.
- Install `@kaibanjs/opentelemetry` in your project.
- Define agents and tasks using KaibanJS.
- Enable OpenTelemetry tracing by subscribing to workflow events.
- Configure your observability platform to ingest OTLP traces.
Source Card
Bringing Production-Grade Observability to AI Agent Workflows with OpenTelemetryThis article highlights the importance of observability in AI workflows and introduces OpenTelemetry integration through KaibanJS.
Hugging Face Blog
- https://huggingface.co/blog/darielnoel/kaibanjs-ai-agent-opentelemetry
- https://opentelemetry.io/
- https://kaibanjs.org/docs
Builder implications
For teams evaluating Production-Grade Observability for AI Agent Workflows with OpenTelemetry, the useful question is not whether the announcement sounds important. The useful question is whether it changes how an agent system is built, tested, operated, or bought. The source from huggingface.co gives builders a concrete signal to inspect: Bringing Production-Grade Observability to AI Agent Workflows with .... That signal should be mapped against the parts of an agent stack that usually become fragile first, including tool contracts, long-running state, evaluation coverage, cost visibility, failure recovery, and the handoff between prototype code and production operations.
Production lens
Treat this as a systems decision, not a headline decision. A builder should ask how the change affects the agent loop, what needs to be measured, which failure modes become easier to catch, and whether the team can explain the behavior to a customer or operator when something goes wrong. If the answer is vague, the technology may still be useful, but it is not yet a production advantage.
Adoption checklist
- Identify the workflow where AI observability, OpenTelemetry, KaibanJS, multi-agent systems already creates measurable pain, such as slow triage, brittle handoffs, unclear ownership, or poor observability.
- Write down the current baseline before changing the stack: latency, cost per run, recovery rate, review time, and the percentage of tasks that need human correction.
- Prototype against a real internal workflow instead of a demo task. The workflow should include imperfect inputs, missing context, tool failures, and at least one approval step.
- Add traces, event logs, and evaluation checkpoints before expanding usage. A new framework or model is hard to judge when the team cannot see where the agent made its decision.
- Keep rollback boring. The first version should let an operator pause automation, inspect the last decision, and return control to a human without losing state.
- Review the source again after testing. The source-backed claim should line up with observed behavior in your own environment, not just with launch copy or release notes.
| Area | Question | Practical test |
|---|---|---|
| Reliability | Does the agent fail in a way operators can understand? | Run the same task with missing data, stale data, and a tool timeout. |
| Observability | Can the team reconstruct why a decision happened? | Inspect traces for inputs, tool calls, model outputs, approvals, and final state. |
| Cost | Does value scale faster than usage cost? | Compare cost per successful task against the old human or scripted workflow. |
| Governance | Can sensitive actions be reviewed or blocked? | Require approval on high-impact actions and log who approved the step. |
What to watch next
The next signal to watch is whether builders start publishing implementation notes, migration stories, benchmarks, or reliability reports around this source. That secondary evidence matters because agent infrastructure often looks clean at release time and only shows its real shape once teams connect it to messy business workflows. Strong follow-on evidence would include reproducible examples, clear limits, documented failure recovery, and customer stories that describe what changed in the operating model.
Key Takeaways
- Do not treat a release as automatically production-ready because it comes from a strong source.
- Use the source as a reason to test a specific workflow, not as a reason to rewrite the entire stack.
- The best early signal is not novelty. It is whether the system becomes easier to observe, recover, and improve.